
Handleidingen
Exam analysis: learning analytics (P’, Rit, Rir value and standard deviation) in student view
The following analytics can be accessed from student view: Scores, perfect score percentage, pass and fail percentages, P value, Rit value, Rir value and the question’s standard deviation. The steps that follow explain where to find this information.
-
Stap 1
- Log in to student view.
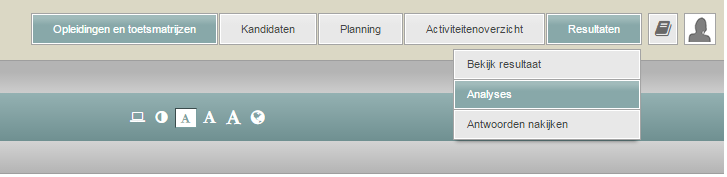
- Click on the Results tab, then select Analysis from the menu.
- Filter the tests to find the one whose analytics you want to see. (You can filter by Blueprint or Test moment using the tabs.)
- Or you can use this shortcut to get to the Learning Analytics.
-
Stap 2
Tab: Complete overview
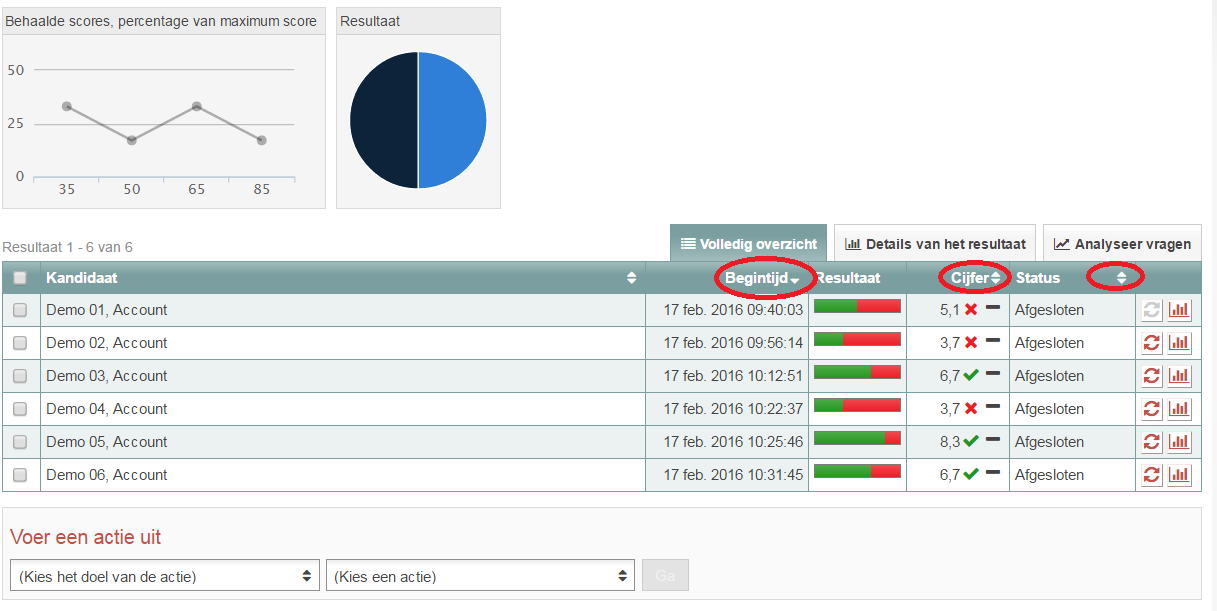
- You end up on this screen of Learning Analytics.
- The line graph shows a percentage of the scores that have been achieved, and the pie chart will show you the percentage of passes and fails if you hover your mouse cursor over it.
- Below the graphs is a list of all students. You can sort them up or down by score, start time or Status. To do so, click the arrows behind Start time, Grades or Status (see image).
- The Action drop-down menu will allow you to export this data to Excel.
-
Stap 3
Tab: Result details
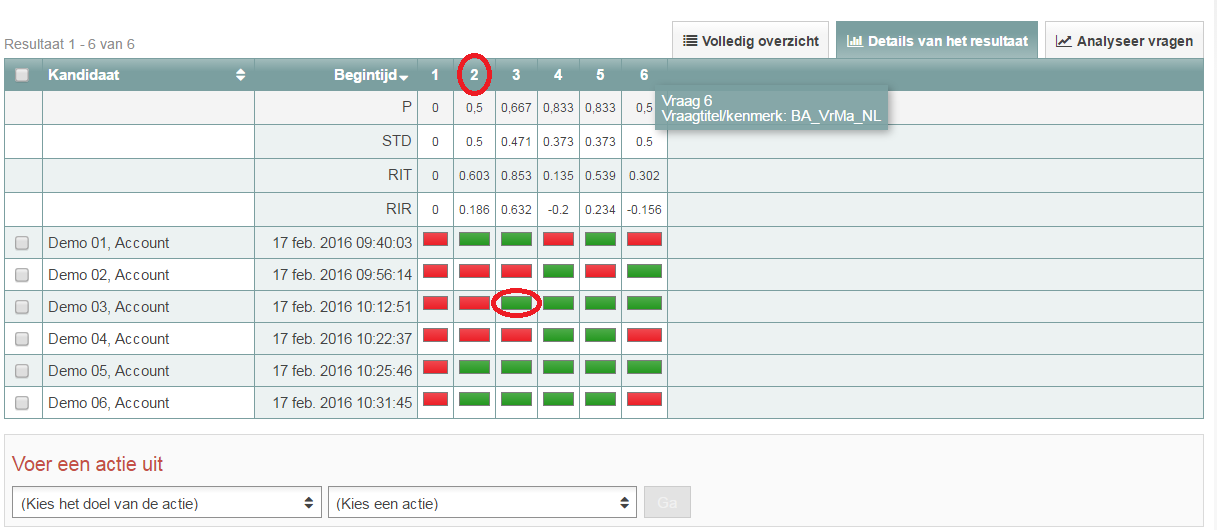
- In the top right corner of the student overview, click the Result details tab to view the P value, standard deviation, Rir value and Rit value for each question and to see how each student answered the questions.
- To see which question you’ll be shown the results and analytics for, you need to hover your mouse over one of the numbers (1 through 9 in the example). That will reveal the name of the question. If you want to see the whole question, you need to click a coloured square (red or green). Once you do, the entire question will be displayed, including the student’s answer.
- The Action drop-down menu will allow you to export this data to Excel.
-
Stap 4
Tab: Analyse questions
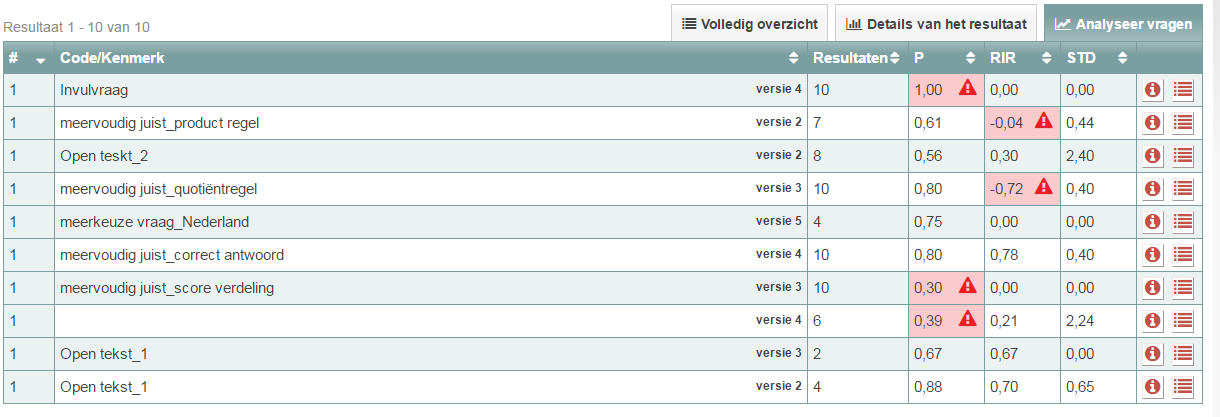
- When you click the Analyse questions tab, you’ll see an overview that includes how many students answered the question and what its P value, Rit value and standard deviation are.
- Values marked with a red triangle deviate from the defined optimal value. Hover your mouse cursor over these triangles for an explanation.
- There are two icons behind the question.
- When you click the icon with the lower-case i (show details), you’ll see the question with some general information about that question, its version and metadata underneath it.
- When you click the icon that looks like a list (show answers given) a number of graphs appear showing what answers the students selected. You can adjust your blueprint directly from this screen if, for instance, it turns out one of your distractors is in fact a correct answer.
-
Tip! Additional practical information about constructing and analysing an exam can be found in our online module on assessment.